Econdiscussion
  • Home
  • Articles
  • About Me

Articles

My Take and an Alternate Synopsis for "Every Man for Himself"

30/10/2014

0 Comments

 
To read the original post, click here
Here is a flow chart of the main ideas presented in the article:
Picture
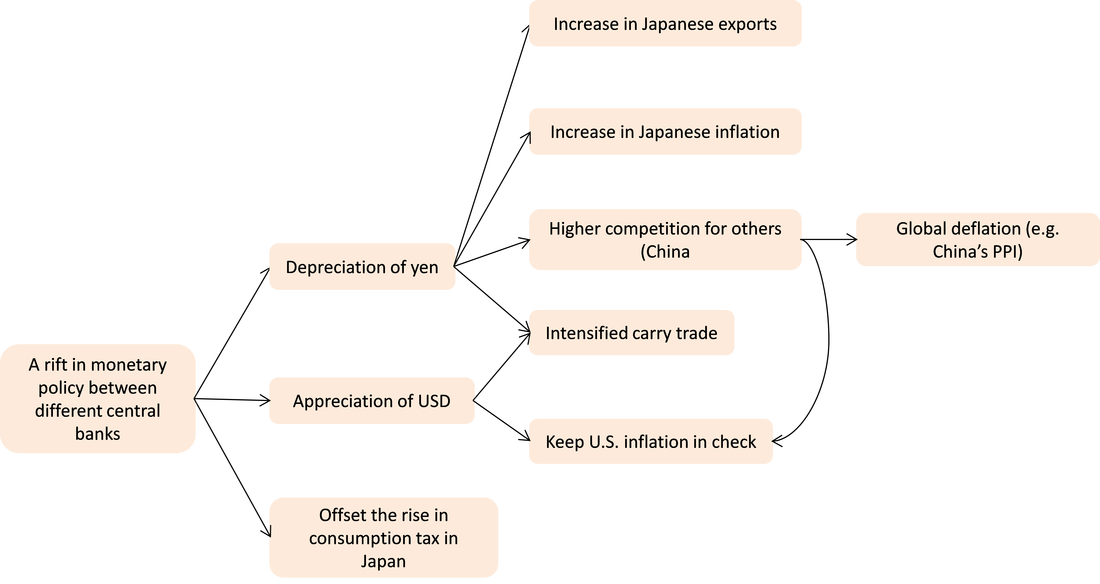
I want to discuss a problem related to the depreciation and export relationship in Japan.

Firstly, this article claims that a depreciation in the JPY should increase exports. Here is a chart of the JPY to USD chart from The Bloomberg.
Picture
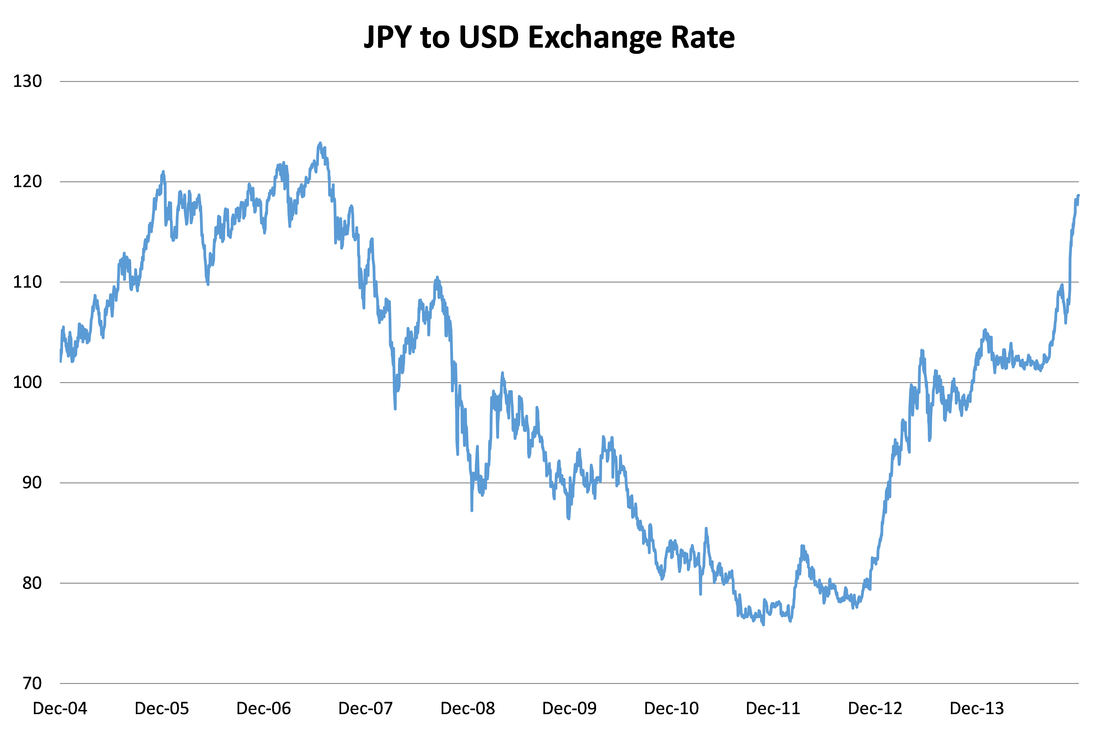
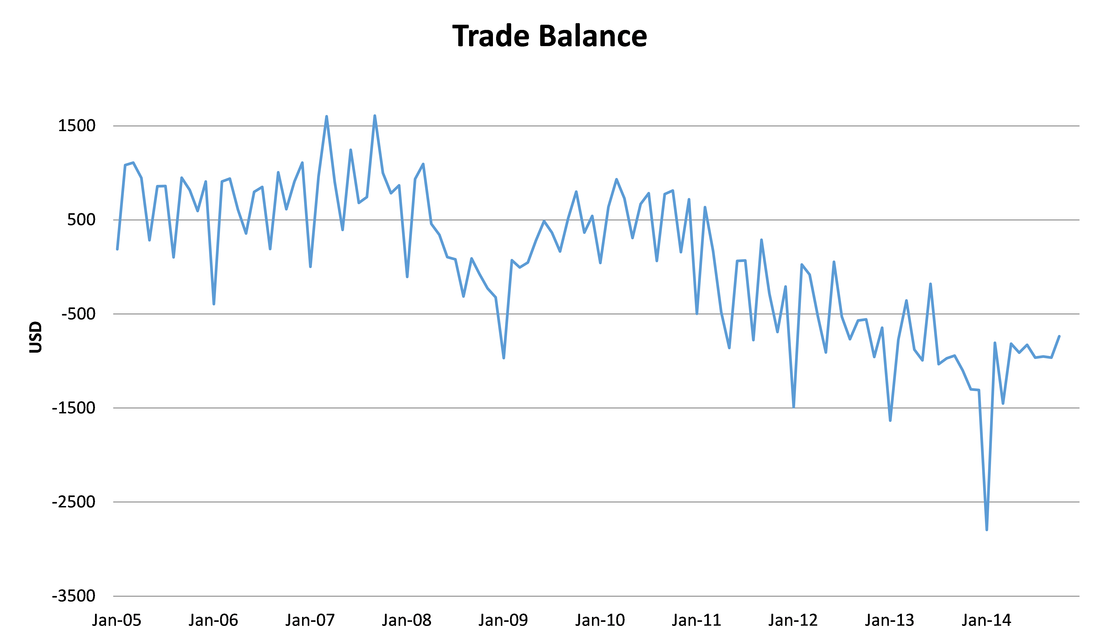
As we can see, there was an appreciation from about 2006 to 2011, followed by a depreciation from 2011 onward. The volume of exports from 2011 to 2014, however, had not increased dramatically, despite the depreciation of the Yen.
Picture
Source: Bloomberg

Why could this be? Many people claim that it has to do with the structural rigidities of Japan (i.e. Japan is no longer producing what people want to buy).
0 Comments

"Every Man for Himself" - The Economist

28/10/2014

0 Comments

 
Synopsis: With all the different directions that different economies are dealing with their QE, what are the repercussions?

Click here to read the original article
Discussion:
This article discusses the repercussions of the lack of synchronization between the Federal Reserve’s and the Bank of Japan's monetary actions. While the Fed has ended its bond-buying practices, the BoJ has just intensified it. Consequently, the yen fell sharply against the dollar, which will hopefully increase exports and production in Japan, battling its long-lasting deflation. However, this means that other exporters might have to lower prices in other countries to compete in the global markets. The writer thinks that this might cause worldwide deflation. The author then talks about how the stagnant state of inflation in the US (which has not yet capitulated to the worldwide deflation that the writer fears) has caused the gold price to drop. The U.S. and Japan’s central banks’ diverging monetary decisions are causing a rift in the global markets.

I will be summarizing the points made in this article in a flow chart in the next post, as well as problems I am seeing while applying this article to the actual situation in Japan.
0 Comments

"Unproductive Production" - The Economist

23/10/2014

0 Comments

 
Synopsis: Is China’s productivity slowing down?

Click here to read the original article
Discussion:
This article discusses the source and extent of China’s productivity slowdown. In other words, to a large extent, China’s slowing economy can be blamed on disappointing growths in productivity. For the past few decades, China’s boom was caused by an increase in labour and capital, as opposed to an increase in efficiency. The measure of where the source of GDP is from is TFP (total factor productivity), which is, according to the article, “subtracting the change in capital and labour deployed from the change in overall output.” I will discuss the problems with this statement later.

Between different people are differing opinions on China’s TFP. Mr. Harry Wu, an economist who has done a lot of research on the shortcomings of Chinese official data, has a pessimistic opinion (which, itself, faces a plethora of problems given the assumptions he made) and cites a negative TFP, while the World Bank’s more hopeful one shows a slowdown in TFP, even if it is positive for the time being.

Exacerbating China’s problem with a showdown of productivity is China’s bad lending and investment decisions. China’s best firms do not have the credit they deserve. With TFP and ICOR (explained later) increasing, China is likely to face large problems.

Key Words:
1.       ICOR: Incremental Capital-Output Ratio is the measure of how much investment is needed to increase growth by a percentage point.
2.       TFP: Total Factor Productivity, as I said earlier, is stated to be the difference between the change in capital and labour and the change in overall output. Math students will understand the problems with this statement. What does subtraction mean? (The figures in the following tables are not based on actual data).
Picture
Does this mean the TFP is 20%-10%=10%? Because this is what the article says. What I have calculated is the change in GDP and the change in input, and I have subtracted the two, as per the instructions of the article.

This is how TFP is actually calculated:

TFP Calculation 2:
Picture
So, the TFP is now 2.1818/2=9.09%

The difference between the two methods is that firstly, there is no subtraction in the second calculation, and secondly, it is not the change in GDP per year by the change in input per year as the first table would suggest, but rather, the change in ratio between GDP and input per year.

The difference between 9.09% and 10% from both tables might seem negligible, but on a large scale, this could make a large difference.

This is not to say that the writer did not understand how TFP was calculated; his or her phrasing was merely meant for readers to understand the general concept. I think it is important to notice these small differences, though.
0 Comments

"Buck to the Future" - The Economist

20/10/2014

0 Comments

 
Synopsis: What is the effect of a strengthening U.S. dollar on different stakeholders?

Click here to read the original article
Discussion:

This article discusses the effects of a strengthening U.S. dollar on various stakeholders. The U.S. economy is currently improving amidst generally weakening economies, such as Germany and France. For another article discussing different impacts on the U.S. dollar (and more specifically, the differences in monetary policy between different economies) on different stakeholders, click here.

Impact on:
1.       Investors: With the economic strength of the U.S. and a weaker world economy, investors are attracted to U.S. markets, where they can finally reap large benefits from a “carry trade” strategy.
The incentive to invest in bonds and stock in America is intensified for investors by America’s economic performance, regardless of the interest rates America offers.
2.       American citizens: Positives for America include an influx of money to fund governments, an increase in purchasing power and a decrease in import prices.
Negatives include less competitive exports, devaluation of overseas profits, and an eventual decrease in GDP.
3.       Other QE-leading economies (i.e. Japan and Europe): Exports are now cheaper, and consequently, more attractive, fuelling production and avoiding deflation. This is especially good for Japan who has been struggling with deflation for decades.
4.       Emerging markets: Capital will flow out of these emerging markets and into the U.S., which will exacerbate their governments’ ever-growing debt problem, especially as they have borrowed in dollars (this is to say that if they have borrowed in dollars, and the price of the dollar goes up, their debt increases as well).
5.       World government: Economies might have to resort to protectionism (in the long, long run), such as America, because the export sector of America will suffer if there is stubbornly high dollar.

Key Words:
1.       Trade-weighted basis: this term is found in the first paragraph of the article. What does it mean? If a currency is calculated on a trade-weighted basis, it means that the currency is valued based on the amount of its currency that is being bought and sold for goods and services.
2.       Carry trade: Carry trade is borrowing from economies with low interest rates and investing in ones with high interest rates, which, in this case, the U.S. In another article, it discusses how carry-trade was nearly impossible for a long while because all interest rates were very similar, i.e. pretty much 0%. The risk with carry-trade is that fluctuations between currencies might be so great that carry traders might find that when they convert their earnings back to their home currency, the value is suddenly so little. On the other hand, it could be very high! For this reason, many people refer to carry trade as “picking up pennies in front of a road roller” – the risk is very high.
0 Comments

"U.S. Quantitative Measures Worked in Defiance of Theory" - Financial Times

15/10/2014

0 Comments

 
Synopsis: Qualitative easing and its effects on quantitative easing.

Click here to read the original article
Discussion:
This article discusses the reasons behind the success of QE, stating that, in theory, QE (buying long-term treasury bonds) shouldn’t have any effects, as it only shifts government debt from cash to treasury.  However, this shift is what made QE1 successful; investors preferred the cash.  In QE2 and QE3, when financial markets were mostly back to normal, what made the difference is the confidence the Fed injected back in the market.  The public and markets felt comforted by the fact that the Fed would do whatever it takes to ameliorate the economy.  This injection of economic confidence is a lesson the Bank of Japan and the ECB should learn in their own efforts to make QE successful.

This article was specifically chosen to show the effect of qualitative easing, which is essentially a bank’s use of forward-looking statements to reassure the market and provide stimulus. This is a prime example of the fact that sometimes, economics hinges on not only theory, but also on the psychological aspect of humans.

0 Comments

"Diving Into the Rich Pool" - The Economist

14/10/2014

1 Comment

 
Synopsis: This article by The Economist suggests that taxing the rich is not the way for governments to alleviate their debt.

Click here to read the original article
Discussion:
While a popular opinion is that taxing the rich during times of economic trouble, this article encourages governments to think twice before doing so, pointing out unintended land negative consequences.  This article answers three questions:

1.     What share of tax do the rich actually pay?
2.     What has happened to the tax burden over the recent decades?
3.     What does the evidence suggest about how the rich respond to changes in taxation?

The rich pay a substantial amount of taxes nowadays (rich Americans pay the most of OECD countries, at 45%).  However, the general trend is that tax burdens have eased up on the rich; many countries have shifted from an extremely progressive tax scheme to a less progressive one-more proportional than anything.

Taxing the rich can be hazardous to an economy-often it is the rich that are most mobile, i.e. an increase in taxes means that the rich leave the country.

Overall, the article suggest that instead of simply increasing tax rates, closing taxation loopholes and broadening the tax base are more efficient ways to bring in income for the government.

Theory:

The phrase in the article “beneficial impact of tax cuts” can be very confusing. How is it that a government could possibly earn more tax revenue by cutting tax rates? The Laffer curve best explains this phenomenon. This is the Laffer curve:
Picture
The x-axis of this curve is the tax rate, while the y-axis is the revenue gained. It can be seen that the peak of this curve is not towards the end, i.e. it is not necessarily that as the tax rate increases, revenue increases. After a certain point, the revenue decreases. This is because more and more people will feel convinced that the tax rate is too high that they need to find a way to avoid the tax – whether that means moving their money to another country or not working altogether. At lower rates of tax, though, the effort of tax evasion might be too high; people might just pay the taxes just because it’s easier than avoiding it.

Notice how the highest tax revenue does not exactly mean a 50% tax; it could be anywhere, depending on the economy. It can also be multi-modal; it does not have to be restrained to one peak.
1 Comment

putting them together: the view on infrastructure

10/10/2014

0 Comments

 
We have earlier discussed three different views on investment and its effects on infrastructure. They are:

1.     Concrete Benefits
2.     Government Spending Booms Not So Great for Long-Term Growth
3.     Bridges to Somewhere

The focus of all these three articles is a bit different: The first article talks about why the time is right for the U.S. to increase infrastructure spending. The second is the most theoretical of the three, providing concrete reasons for why panicked governments during recessions should not jump immediately at a Keynesian approach of, as Keynes was rumored to have said, hiring people to dig holes and then fill them back up again. The last article discusses the issue of causality (does infrastructure spending mean more GDP or does an increase in GDP cause infrastructure spending?). 

It is worth piecing these three articles together to get an overall outlook on infrastructure and investment.

From the first article, we can see that successful infrastructure projects will produce enough revenue to not only cover the costs of the project, but also boost the economy. This article does warn us against investing in the wrong projects.

The second article discusses the reasons why investing in the wrong projects can be harmful, roughly stating these three points (more about those points can be found in the original blog post):

1.     The projects governments resort to were usually those that were shelved because of its lack of popularity
2.     The governments will be saddled with more debt (a fact that the first article disagrees with)
3.     There will be diminishing returns when governments try to expand on old projects

The third article agrees that bad investments are harmful for those reasons, and then proceeds to show the benefit of good investments, especially in China. For example, a high-altitude railway from Tibet to Qinghai shows a 33% increase in the regional GDP.

John Maynard Keynes was not wrong when he urged governments to pump out jobs during tough times. What we must remember is to make sure those jobs are worthwhile, by making sure the projects are worthwhile. Otherwise, governments could be saddled with even more problems in the future.
0 Comments

"Bridges to Somewhere" - The Economist

9/10/2014

0 Comments

 
Synopsis: An exploration of the links between infrastructure spending, growth and GDP.

Click here to read the original article
Discussion:
This article discusses the value of investing in infrastructure, particularly in China.  China’s large plans to provide infrastructure lending programs to poorer countries begs the question of whether infrastructure really boosts GDP or whether a rise in GDP leads to increases in infrastructure projects. This question is usually referred to as the causality question.

An analysis of a high-altitude railway built from Tibet to one of China’s poorest regions, Qinghai, suggests that the answer to the causality question that increased infrastructure leads to higher GDP.  The result of building this railway was a 33% increase in GDP per capita in Qinghai.

However, there are some shortcomings to increases in investment. A country must be ready to face the fact that returns on investment will dwindle. It must also consider the fact that increased infrastructure could damage GDP, because localities no longer feel the need to produce when more advanced cities provide the same good or service (which the country’s production level will stay the same, the city’s will diminish).  A reduction in GDP may also be a problem when decentralization becomes popular and the “clustering effect that makes big cities fertile grounds for innovation” ebbs.

In summary, while there is no question that infrastructure is a crucial pillar to long-term growth, it must be kept in mind that it is not the only pillar.

For more on infrastructure and investment, read “Concrete Benefits” and “Government Spending Booms Not So Great for Long-Term Growth”
0 Comments

"Government Spending Not So Great for Long-Term Growth" - Financial Times

8/10/2014

0 Comments

 
Synopsis: The popular Keynesian idea of large-scale spending on various projects to boost growth during a recession is called into question.

Click here to read the original article
Discussion:
This article discusses the view that public investment by itself can potentially be more harmful than helpful when poor countries to catch up.  The IMF cites a few reasons for this:

1.     Many countries waste money on useless investments.  This is because, during times of big push, governments implement shelved but rejected plans – as it turns out, they are usually objected on the grounds that its impact in the long run would be meaningless.  Nonetheless, the case of already having the project planned out and support from government officials who had earlier supported the i.e. makes the useless investment project easy and quick to implement.
2.     The crowding-out effect can reduce private investments that could have been more beneficial.
3.     Expanding on useful projects (e.g. rebuilding after way) only provides diminishing marginal returns on capitals.
4.     The government saddles itself with high debt

For public investments to have a positive impact, governments must address the problems above, as well as amass information about which investments are the most useful ones.

For more on infrastructure and investment, read “Concrete Benefits” and “Bridges to Somewhere”
0 Comments

"Concrete Benefits" - The Economist

8/10/2014

0 Comments

 
Synopsis: Should the U.S. invest in infrastructure now?

Click here to read the original article
Discussion:
This article argues that the U.S. government must take the opportunity now to increase public investment, before this fiscal climate changes.  The writer argues that the fear of increasing taxes to fund such projects is unfounded, as is the fear of slipping further into debt.  He or she cites examples of a boost in GDP due to such projects, covering and surpassing the debt caused.  In fact, it is with slow-growing economies that borrowing and funding is most profitable, due to low interest rates and minimal competition for loans.  It is for these reasons that the writer argues that the U.S. should invest in public goods – the economic climate is just right.  The only problem is what to invest in: while most economies can easily pinpoint deteriorating infrastructure, those projects may be a waste of time and money.

Key words:
Natural monopoly – This is where the lowest price can only be achieved if the market has a monopoly. The article gives three examples of natural monopolies:
“telephone network, electricity grid or sewer system.” The article goes on to explaining why it is best to have a natural monopoly – “fixed costs… are typically high and operating costs relatively low”.

Crowding in – This is the opposite of the crowding out effect, and is where government spending on public projects boosts the demand for a good, and so, increases the private investment in it.

For more on infrastructure and investment, read “Government Spending Booms Not So Great for Long-Term Growth” and “Bridges to Somewhere"
0 Comments
<<Previous

    Categories

    All
    Abenomics
    Adam Smith
    Adverse Selection
    Ageing
    Amazon
    Arrows
    Arthur Okun
    Asset
    Asymmetric Information
    Ben Bernanke
    Booms And Busts
    Braess' Paradox
    Brazil
    Bretton Woods
    Brexit
    Bubble
    Bull Market
    Business Cycle
    Capital Control
    Capital Flows
    Capital In The Twenty First Century
    Capital In The Twenty-First Century
    Carry Trade
    Causation
    Central Bank
    China
    Christopher Sims
    Classical Economics
    Consumption
    Counter-cyclical
    CPI
    Creative Destruction
    Crisis
    Daron Acemoglu
    David Cameron
    David Ricardo
    Debt
    Debt-to-GDP
    Deflation
    Deleverage Cycle
    Demography
    Devaluation
    Developing Economies
    Development
    Diffusion
    Diminishing Returns
    Dominant Strategy
    Dominated Strategy
    ECB
    Economic History
    Economic Theory
    Equality
    Equitity
    Equity
    Equity Investments
    EU
    Exchange Rate
    FDI
    Fed
    Federal Reserve
    Finance
    Financial Crisis
    Financial Instability Hypothesis
    Financial-instability Hypothesis
    Financial Times
    Fiscal Multiplier
    Fiscal Policy
    Fixed Exchange Rate
    Fleming
    Floating Exchange Rate
    Free Market
    Free Trade
    Freshwater
    Game Theory
    GDP
    George Akerlof
    Germany
    GFC
    Gini Coefficient
    Global Financial Crisis
    Globalization
    Government Intervention
    Government Spending
    Great Depression
    Growth
    Heckscher-Ohlin
    Helene Rey
    Hyman Minsky
    ICOR
    Illiquid
    Immigration
    Income
    Inequality
    Inflation
    Infrastructure
    Innovation
    Interest Rates
    Investment
    Italy
    James Robinson
    Janet Yellen
    Japan
    Jean Tirole
    J.M. Keynes
    John Nash
    Keynesian Economics
    Labor
    Lawrence Summers
    Leverage
    Lindau
    Liquid
    Malaysia
    Managed Exchange Rate
    Mario Draghi
    Matteo Renzi
    Michael Spense
    Minsky Moment
    Mixed Strategy
    Monetary Policy
    Monopoly
    Monopsony
    Moral Hazard
    Mundell
    Mundell-Fleming Trilemma
    Nash
    Nash Equilibrium
    Nigeria
    Nobel
    Nobel Laureates
    Nobel Prize
    Paul Krugman
    Paul Samuelson
    Perfect Information
    Phillips Curve
    Politics
    Poverty Traps
    Principal Agent Problem
    Prisoner's Dilemma
    Productivity
    Protectionism
    QE
    Qualitative Easing
    Quantitative Easing
    Redistribution
    Regulation
    Retrenching
    Rich
    Risk
    Robert Shiller
    Saltwater
    Saving
    Secular Stagnation
    Shiller
    Shinzo Abe
    Signaling
    Stakeholders
    Stolper-Samuelson Theorem
    Strategy
    Subsidies
    Tariff
    Taxation
    Taxes
    The Economist
    The Market For Lemons
    Theory Of Comparative Advantage
    Thomas Piketty
    Total Factor Productivity
    Trade
    Trilemma
    UK
    Unemployment
    U.S.
    USD
    Wage Benefits
    Wages
    Wealth
    Wealth Effect
    Wolfgang Stolper
    WTO
    Yuan

    Author

    JANANI DHILEEPAN
    A gap year student trying to explore real-world economics

    Archives

    May 2018
    February 2018
    January 2018
    December 2017
    November 2017
    April 2017
    February 2017
    December 2016
    October 2016
    September 2016
    August 2016
    July 2016
    May 2016
    March 2016
    January 2016
    November 2015
    September 2015
    August 2015
    July 2015
    June 2015
    April 2015
    March 2015
    February 2015
    January 2015
    December 2014
    November 2014
    October 2014
    September 2014

    RSS Feed

Proudly powered by Weebly